Almost every threat model ends the same way: a list of threats, each with a likelihood, an impact and a score. The grid behind those scores, the risk matrix, is so familiar that teams rarely stop to define it. That's where the trouble starts. Two engineers score the same threat a 6 and a 15, the room argues about numbers instead of fixes, and the "Critical" column fills up with everything anyone was worried about.
This guide covers how a 5×5 risk matrix works, how to write likelihood and impact scales that people score the same way, a worked example from a real threat model, and the places where a matrix will mislead you if you let it.
What a risk matrix is
A risk matrix is a grid with likelihood on one axis and impact on the other. You place each threat in the cell that matches its two ratings, and the cell tells you how serious it is. With a 1–5 scale on each axis, the usual score is likelihood × impact, which runs from 1 to 25. The scores are then grouped into bands so the conversation is about four categories, not twenty-five numbers.
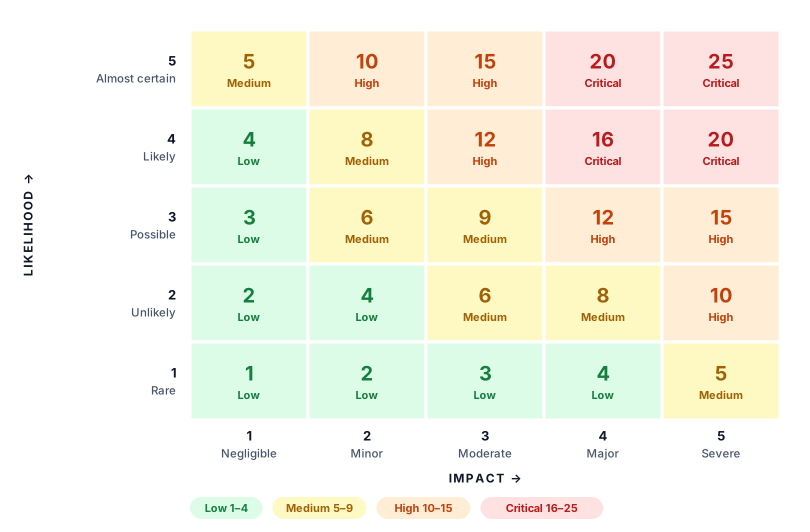
The bands are a choice, not a law. These are the ones ThreatTree uses, and they're a common split. What matters more is that everyone on the team uses the same bands, and that each band means a different response. That comes later in this guide.
Write the scales down before anyone scores
Most scoring disagreements aren't about the threat. They're about what "3" means. One person reads likelihood as "how often have we seen this", another as "how hard is it to pull off". Fix that once, in writing, with descriptions taken from your own product. Here is a starting point for a typical web product.
| Likelihood | What has to be true for the attack to work |
|---|---|
| 5 Almost certain | Reachable from the internet with no account and no special skill. Bots and scanners will find it without anyone targeting you. |
| 4 Likely | Needs an ordinary account, a public tool or a well-documented technique, and a little effort. |
| 3 Possible | Needs one specific condition: a particular role, insider access, a second bug to chain with, or a skilled attacker with a reason to pick you. |
| 2 Unlikely | Needs several things to line up, privileged access, or knowledge an outsider would have to work hard for. |
| 1 Rare | Needs a capability few attackers have, or an existing control makes it impractical. |
| Impact | What happens if it succeeds |
|---|---|
| 5 Severe | Many customers' data exposed or altered, money moved, a regulator notified, or the product down at the worst possible time. The kind of incident customers leave over. |
| 4 Major | One customer's sensitive data exposed, individual accounts taken over, or a core feature unavailable for hours. |
| 3 Moderate | Limited data or a non-core feature affected. Some customers notice; recovery takes effort but no outside help. |
| 2 Minor | No direct harm to customers, but something is lost, such as an audit trail or an internal process. |
| 1 Negligible | No real harm to customers or the business. |
Notice that the likelihood scale describes what the attacker needs, not how often it has happened. For most product teams there's no incident history to count, but everyone can agree on whether an attack needs an account, an insider or a second bug. That's also why likelihood falls when you add a control: you've added something the attacker needs.
Rewrite the impact examples for your business. A clinic, a bank and a game studio will describe "Severe" very differently, and the descriptions only help if people recognise their own product in them.
A worked example: ten threats on one matrix
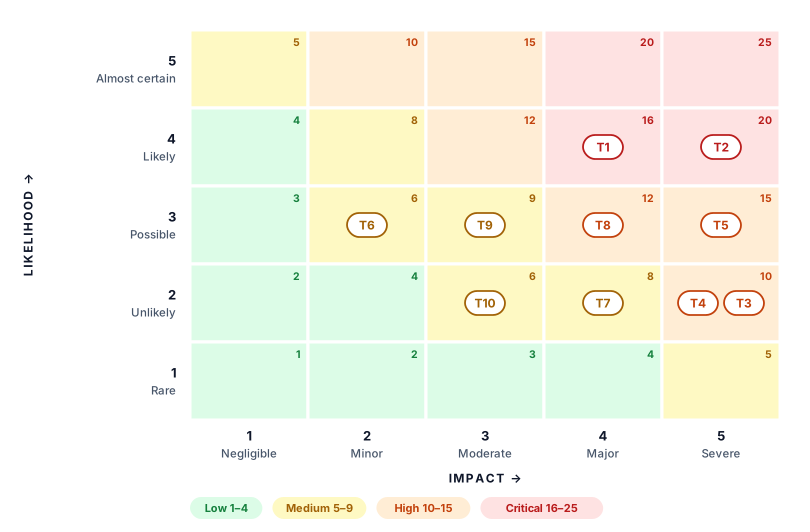
Our threat model example walks through Invoicely, a small invoicing app, and ends with ten scored threats. Here they are on the matrix. The numbers in the corners are the cell scores; the labels are the threats.
| # | Threat | L | I | Score |
|---|---|---|---|---|
| T2 | A customer can read other customers' invoices by changing the ID (IDOR) | 4 | 5 | 20 Critical |
| T1 | Credential stuffing on login | 4 | 4 | 16 Critical |
| T5 | Admin console shares the API's database role | 3 | 5 | 15 High |
| T8 | Session token readable by JavaScript | 3 | 4 | 12 High |
| T4 | Forged payment webhook marks invoices as paid | 2 | 5 | 10 High |
| T3 | PDF links never expire | 2 | 5 | 10 High |
| T9 | One account floods the PDF render queue | 3 | 3 | 9 Medium |
| T7 | Stored XSS in invoice notes | 2 | 4 | 8 Medium |
| T6 | No audit log in the admin console | 3 | 2 | 6 Medium |
| T10 | A mistyped email address exposes an invoice | 2 | 3 | 6 Medium |
What the matrix tells you that the list doesn't
- Read the right-hand column on its own. Four threats sit at impact 5: T2, T5, T4 and T3. Two of them only score 10 because they're unlikely today. If one assumption changes, say the webhook endpoint leaks or PDF links start appearing in search results, they jump straight into Critical. The score hides that; the column shows it.
- Likelihood is what you can usually move. Rate limiting and a breached-password check don't make a hijacked account any less damaging, but they make T1 much harder. Most fixes move a threat down the matrix, not to the left.
- Impact moves when you shrink what's reachable. T5 is a 5 because the admin console can reach every customer's data. Giving it its own read-only role doesn't make a rogue support agent less likely; it makes one far less damaging. That fix moves the threat left.
- Two threats can share one fix. Short-lived, signed PDF links fix T3 and take most of the risk out of T10. Grouping by fix, as our guide to prioritizing a backlog of threats suggests, often beats working strictly down the scores.
Five ways a risk matrix misleads
Risk matrices are popular because they're quick, not because they're precise. Louis Anthony Cox's 2008 paper "What's Wrong with Risk Matrices?" (Risk Analysis) showed that matrices can give identical ratings to very different risks, and sometimes rank a smaller risk above a larger one. You don't need to abandon the matrix, but you should know where it bends.
- Same score, different risk. A 2 × 5 and a 5 × 2 are both 10. One is a rare catastrophe, the other a constant nuisance, and they need very different responses. Keep L and I visible next to every score, and when scores tie, look at impact first.
- Cliffs at the band edges. 9 is Medium and 10 is High. A one-point disagreement about likelihood can move a threat across a line that changes its deadline. Only argue about a score when the argument changes what you'll do.
- The numbers are labels, not measurements. A likelihood of 4 isn't twice a likelihood of 2; the scale is ordered, not measured. Multiplying gives you a rough order, not a quantity, so don't add scores up into a "total risk" or report an average.
- Scoring the worst case. Almost any threat can be argued up to impact 5 if you chain enough "and then". Score the realistic outcome of this threat on its own. If the worst case needs three more steps, that's an attack tree, not a higher score.
- Scoring once. Scores describe the system as it was on the day you scored it. A new integration, a new role or a fix that lands changes them. Rescore at the moments listed in when to re-threat-model, not on a calendar alone.
How to score consistently
- Calibrate on two or three reference threats. Agree on their scores first and keep them at the top of the list. "Is this more or less likely than our login brute-force?" is an easier question than "is this a 3?"
- Score privately, then reveal. Planning-poker style: everyone picks a number, everyone shows at once. Big gaps usually mean people imagined different attacks, which is worth two minutes of discussion. Small gaps aren't.
- Score the system as it is today. Not as it will be once the planned fix ships. When the fix lands, rescore the threat; the difference is the risk the fix removed.
- Score concrete steps, not goals. "Steal customer data" can't be scored honestly; "read another customer's invoice by changing the ID" can. In an attack tree, that means scoring the leaves. AND and OR gates only describe how steps combine, so they don't get a score of their own.
- Use CVSS as an input, not the answer. A scanner's base score knows about the flaw and nothing about your system. Our post on CVSS versus threat model risk shows how the same CVE can land in very different cells.
Turn each band into a decision
A matrix earns its place when each band triggers a different response. Here's an example policy; adjust the timings to your release cycle and appetite for risk.
| Band | Example response |
|---|---|
| Critical (16–25) | Named owner today. Fix, or put a compensating control in place, before the next release. |
| High (10–15) | Owner and a planned fix this quarter. Watch impact-5 entries: they're one assumption away from Critical. |
| Medium (5–9) | In the backlog with an owner. Fix when the area is next touched, or group with a related fix. |
| Low (1–4) | Accept explicitly: write down who accepted it and why, so it's a decision rather than a silence. |
When a fix isn't possible in time, a compensating control can bring likelihood or impact down while the real fix waits. Whatever you decide, record it in a risk register next to the score, so the next person can see what was decided and why.
3×3 or 5×5?
A 3×3 matrix (low, medium, high on each axis) is enough for a first workshop. It's fast and hard to argue about. Its weakness is the middle: most threats land in the centre cell, and you lose the ability to separate them. A 5×5 gives room to separate threats when the list grows past a dozen, and the bands bring it back down to four groups when you need the simple view.
Going beyond 5×5 rarely helps. More levels mean more boundaries to argue about, the same lesson teams learned from adding factors to DREAD.
Frequently asked questions
What is a 5×5 risk matrix?
A grid with five levels of likelihood on one axis and five levels of impact on the other. Each threat is placed in a cell, and the cell's score, usually likelihood × impact from 1 to 25, is grouped into bands such as Low, Medium, High and Critical.
How do you calculate a risk score from likelihood and impact?
Rate each on a 1–5 scale using written definitions, then multiply them. A threat that is Likely (4) with Severe impact (5) scores 20. Then map the score to a band. With ThreatTree's bands, 1–4 is Low, 5–9 Medium, 10–15 High and 16–25 Critical.
Is a risk matrix the same as a risk heat map?
Usually, yes. "Heat map" describes the colouring: green in the low corner, red in the high corner. Some teams use "heat map" for the version with their actual threats plotted on it, like the Invoicely example above.
Should I use a 3×3 or a 5×5 risk matrix?
Start with 3×3 if you're scoring for the first time or have only a handful of threats. Move to 5×5 when too many threats land in the middle cell to tell apart. Either works if the scales are written down and each band leads to a different response.
Medical device teams will recognise this grid: ISO 14971 rates the severity and probability of harm, and security risks are expected to sit alongside safety risks. See threat modeling for medical devices, or our guide to ISO 27001 risk registers if your scores are headed for an auditor.